What metrics matter most in LLM observability?
Start with request logs, latency, error rate, retries, token usage, and cost per successful request. These metrics connect reliability and spend decisions.
llm observability
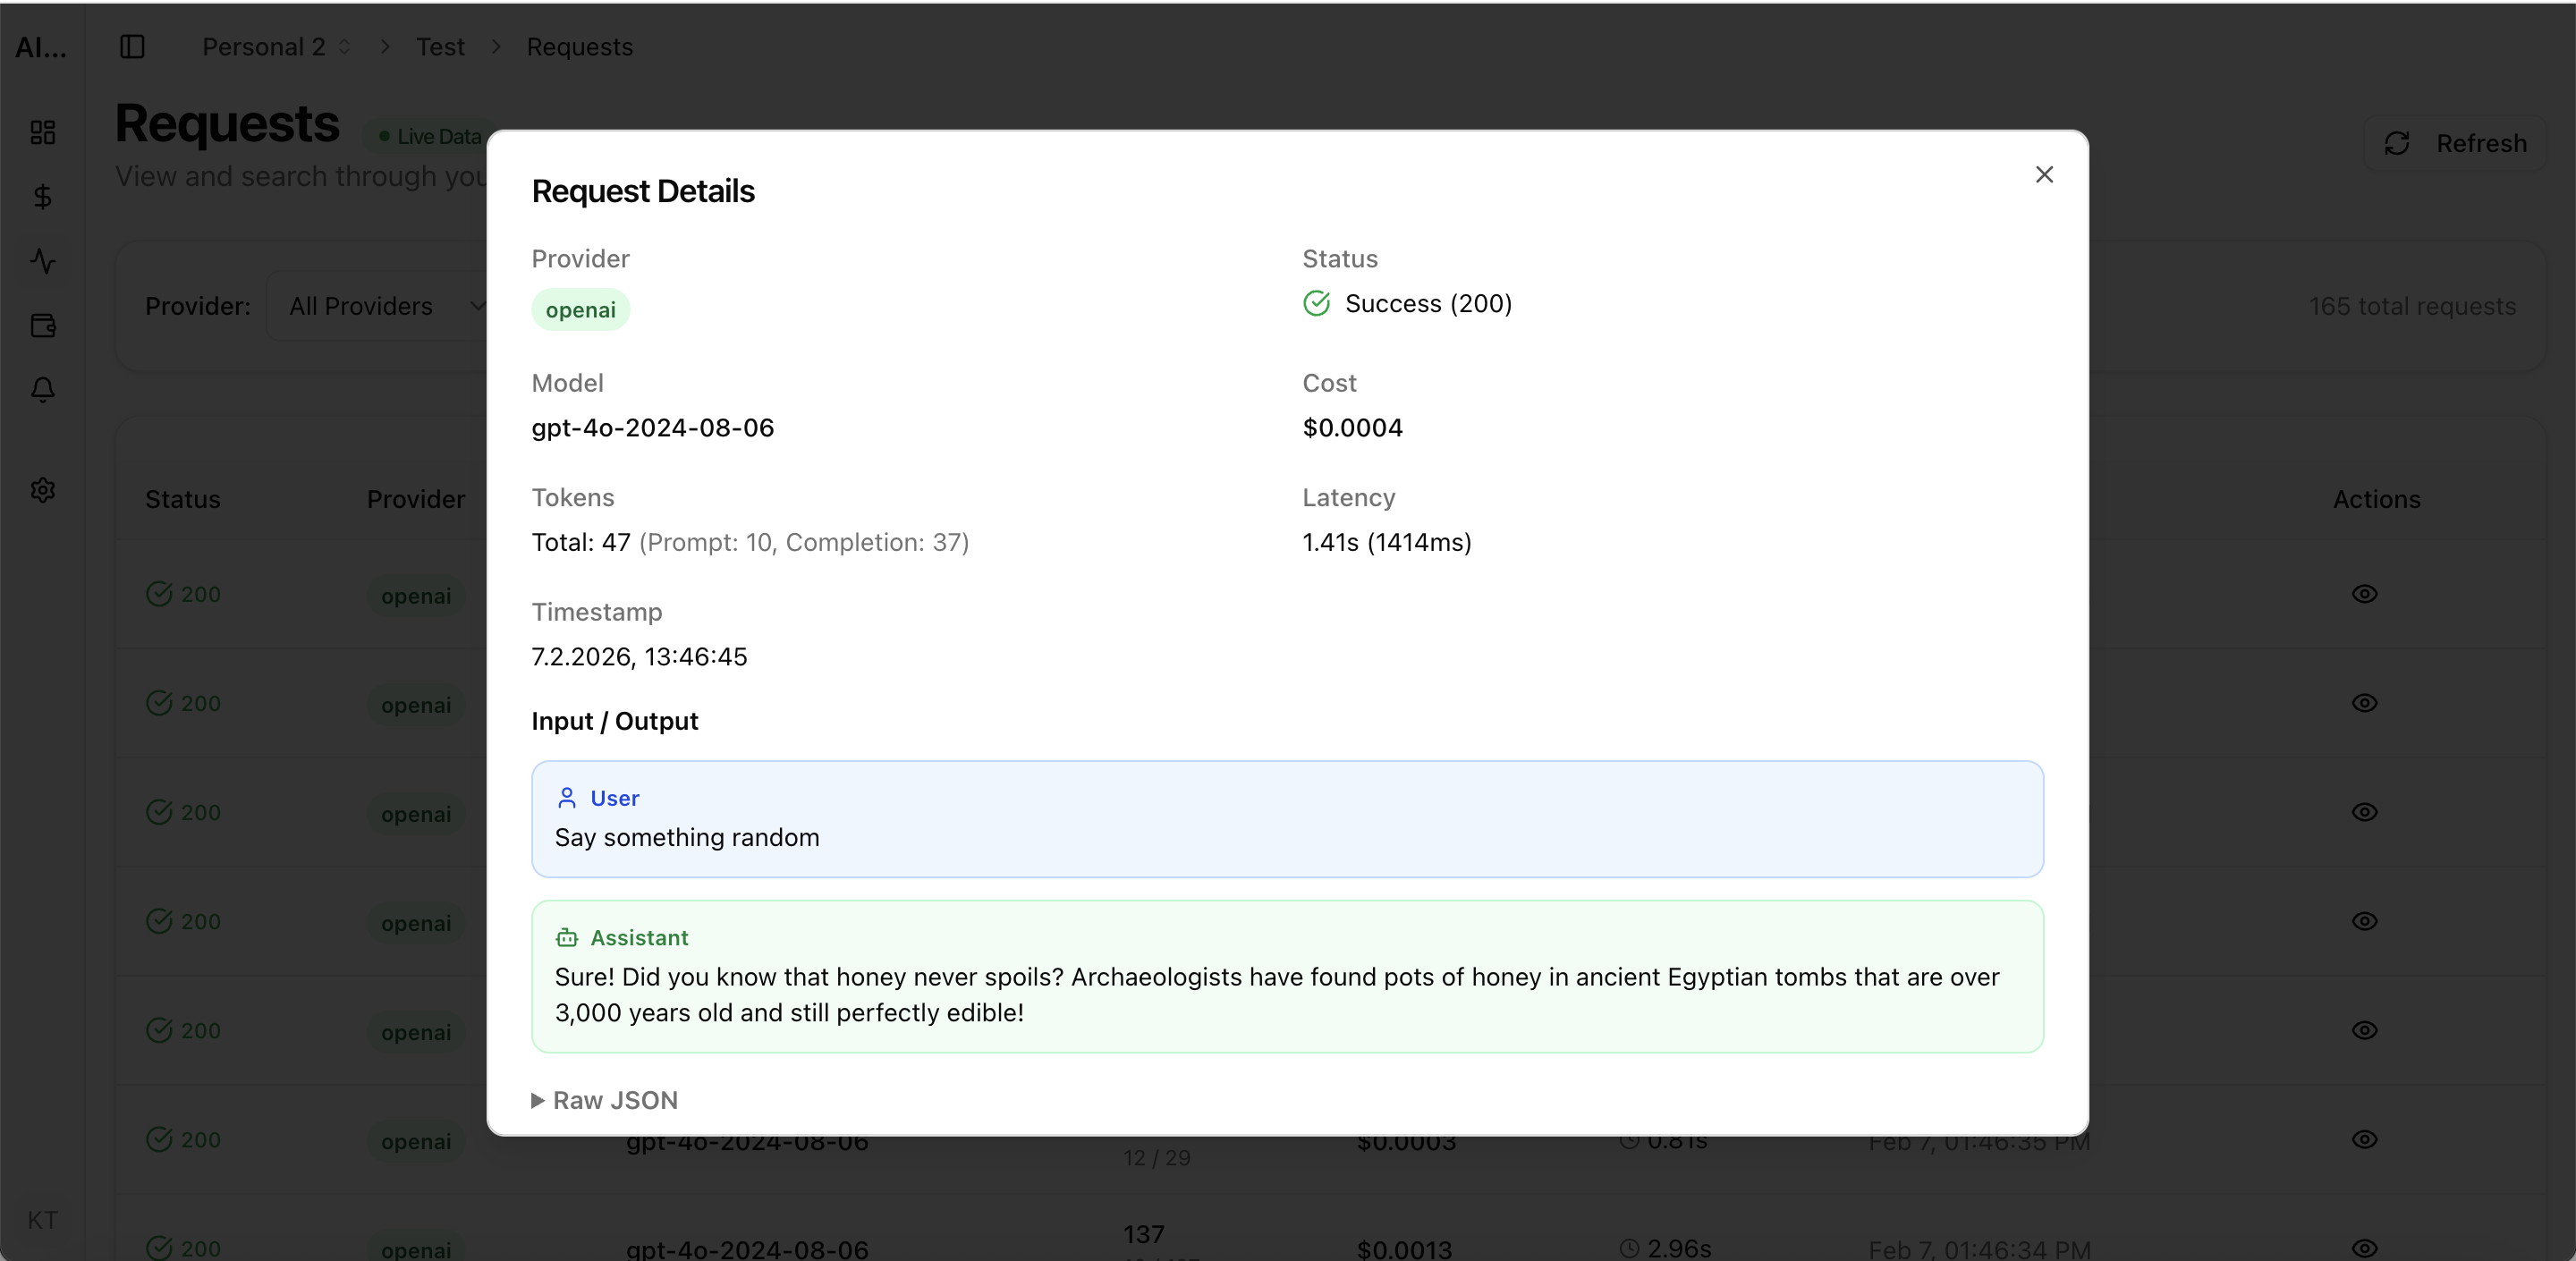
Use LLM observability to track requests, costs, latency, errors, and provider performance in one dashboard for production teams.
Built for teams comparing observability, cost control, and provider operations workflows before rolling out production AI features.
| Metric | Why it matters |
|---|---|
| Request logs | Debug prompts, payloads, retries, and model routing decisions. |
| Latency by endpoint/model | Protect UX and SLOs for AI-powered workflows. |
| Errors and retries | Find instability that increases cost and incident load. |
| Usage + cost together | Avoid optimizing reliability and spend in separate tools. |
Real UI snapshot from AI Cost Board used in production workflows.
Dashboard view for model, provider, and workspace spend tracking.
Track retrieval + generation cost, latency, retries, and error patterns for RAG pipelines in production.
Monitor AI copilot usage, cost per user, latency, and error rates across product surfaces and cohorts.
Track AI support automation cost, latency, errors, and resolution quality by queue, channel, and team.
Monitor cost, usage, latency, errors, request logs, and provider performance in one operational dashboard.
Start with request logs, latency, error rate, retries, token usage, and cost per successful request. These metrics connect reliability and spend decisions.
No. Production teams also need spend visibility, budget alerts, and provider-level analytics to run AI systems safely at scale.
AI Cost Board focuses on observability plus cost control and governance, combining request evidence with budget and project-level monitoring workflows.