Proof from the product
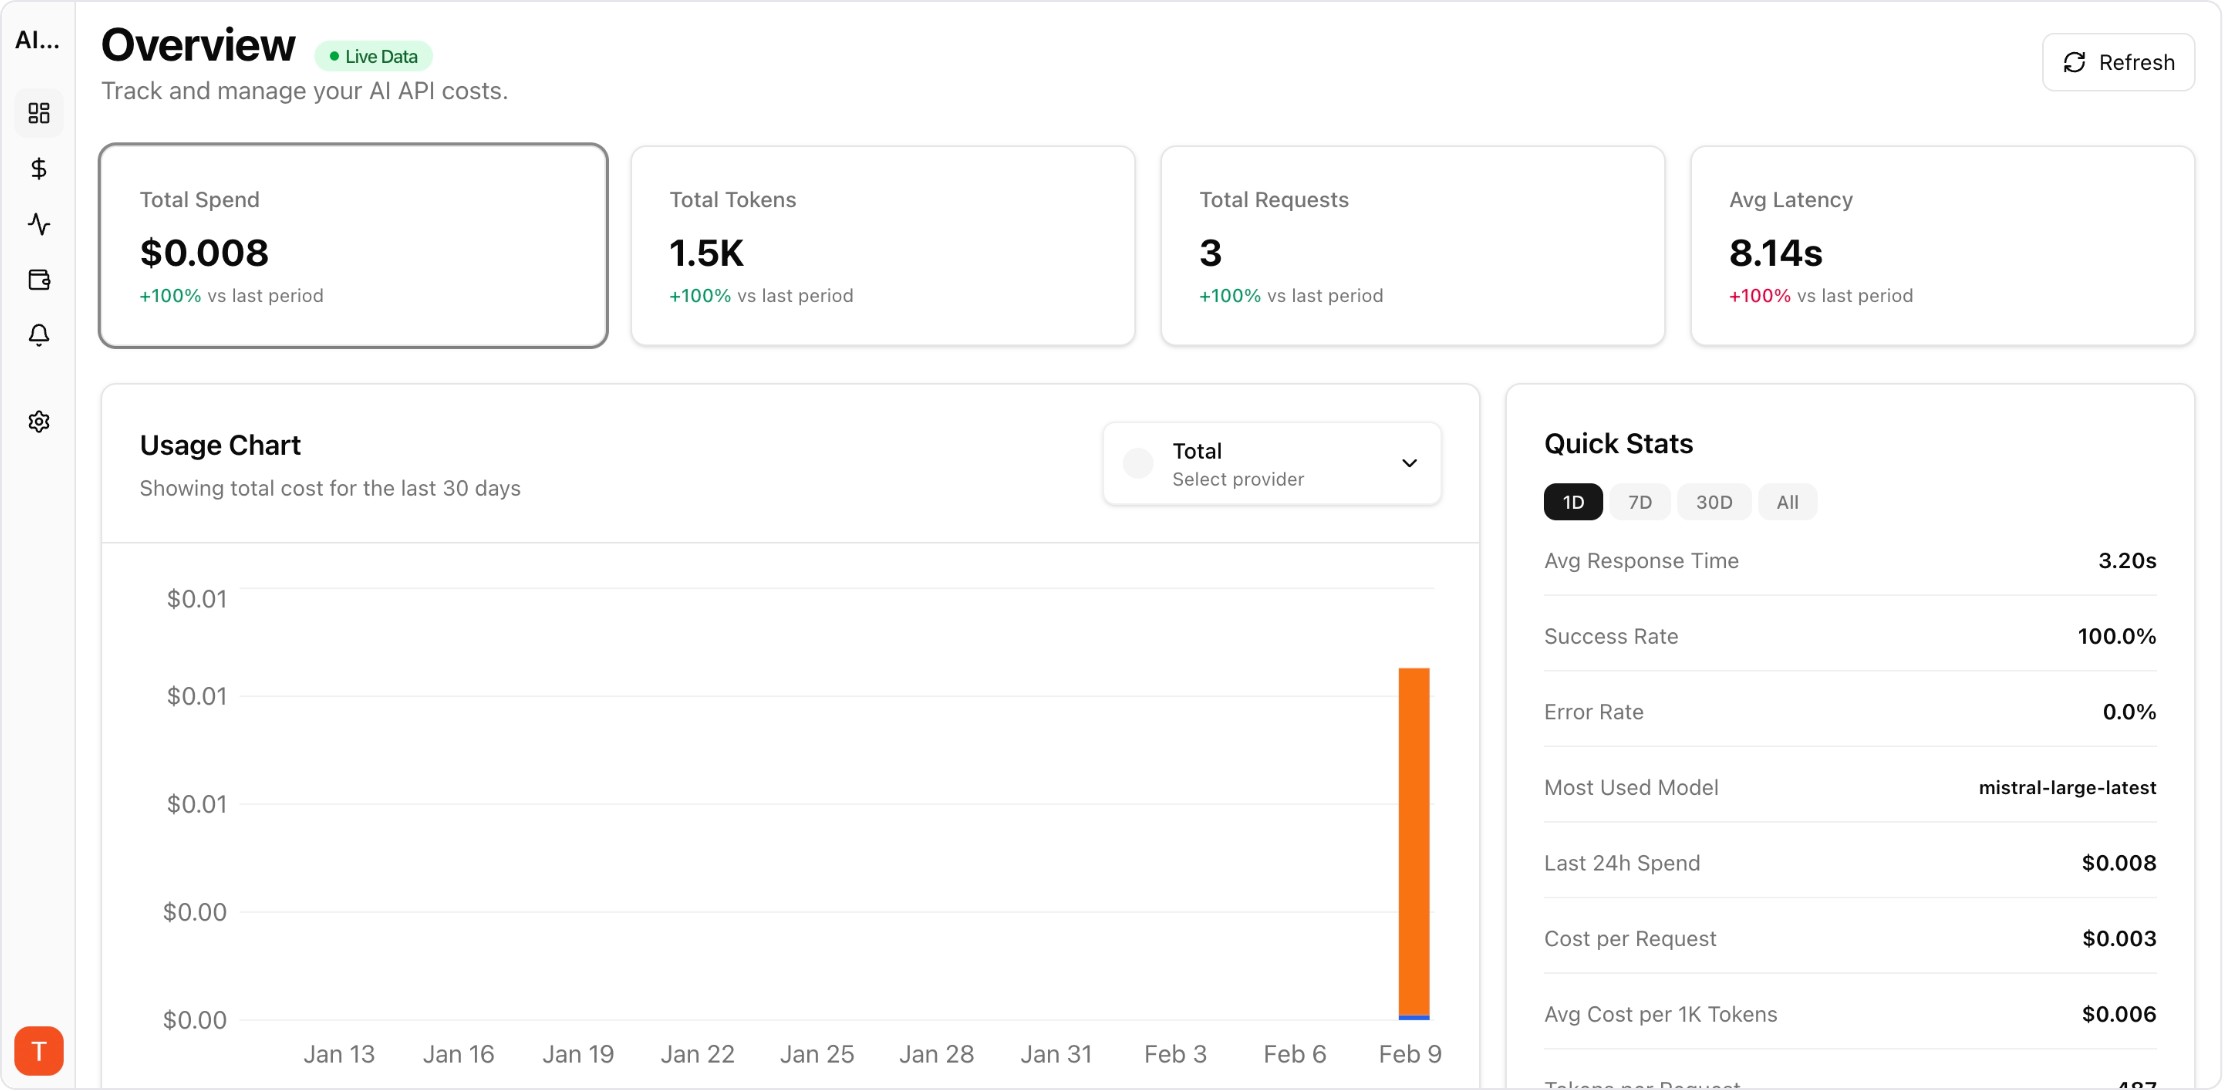
Real UI snapshot used to anchor the operational workflow described in this article.
Most production AI applications use multiple LLM providers — Claude for long-context reasoning, GPT-4 for general tasks, Gemini for cost-effective processing. But monitoring costs across three separate billing dashboards creates blind spots and delays cost optimization. Setting up unified monitoring takes under 30 minutes and immediately gives you the cross-provider visibility that individual billing pages cannot provide.
Real UI snapshot used to anchor the operational workflow described in this article.
Different models excel at different tasks. Claude handles long documents and nuanced reasoning well. GPT-4 offers broad general capability and a mature ecosystem. Gemini provides competitive pricing for high-volume processing. Using the right model for each task optimizes both quality and cost. But this multi-provider strategy creates a monitoring challenge that unified dashboards solve.
In AI Cost Board, connect each provider by adding your API key in the provider settings. The platform auto-discovers available models, begins tracking usage, and maps token consumption to current pricing. Connect OpenAI, Anthropic, and Google in sequence — each takes about 2 minutes. Within 5 minutes of your first API calls, cost data appears in the unified dashboard.
Configure your dashboard to show: (1) Total daily spend across all providers in one chart. (2) Per-provider spend breakdown. (3) Per-model cost comparison within and across providers. (4) Project-level views showing which features use which providers. This cross-provider view instantly reveals cost optimization opportunities like using a cheaper model for tasks currently routed to an expensive one.
Set separate budget alerts for each provider plus a total spend alert. Provider-specific alerts catch issues like unexpected model upgrades or pricing changes. The total alert catches aggregate overspend even when individual providers look normal. Configure anomaly detection across all providers to catch unusual patterns automatically.
Use the unified dashboard to compare: cost per task completion across providers, latency vs cost tradeoffs, error rates by provider, and cost trends over time. This data drives informed decisions about model routing — when you can see that Provider A costs 3x more than Provider B for equivalent quality on a specific task, the optimization action is clear.
Multi-Provider LLM Strategy: How to Reduce Risk and Improve Uptime in Production
provider-strategy · how-to
AI Cost Anomaly Detection Playbook for High-Volume LLM Products
observability · how-to
Expensive Prompt Red Team Checklist: Find Cost Risks Before Production
governance · how-to
How to Track LLM API Costs Across Multiple Providers
cost-tracking · how-to
Unified multi-provider monitoring is essential for any team using more than one LLM provider. The 30-minute setup investment pays for itself the first time you catch a cross-provider cost optimization opportunity.