Proof from the product
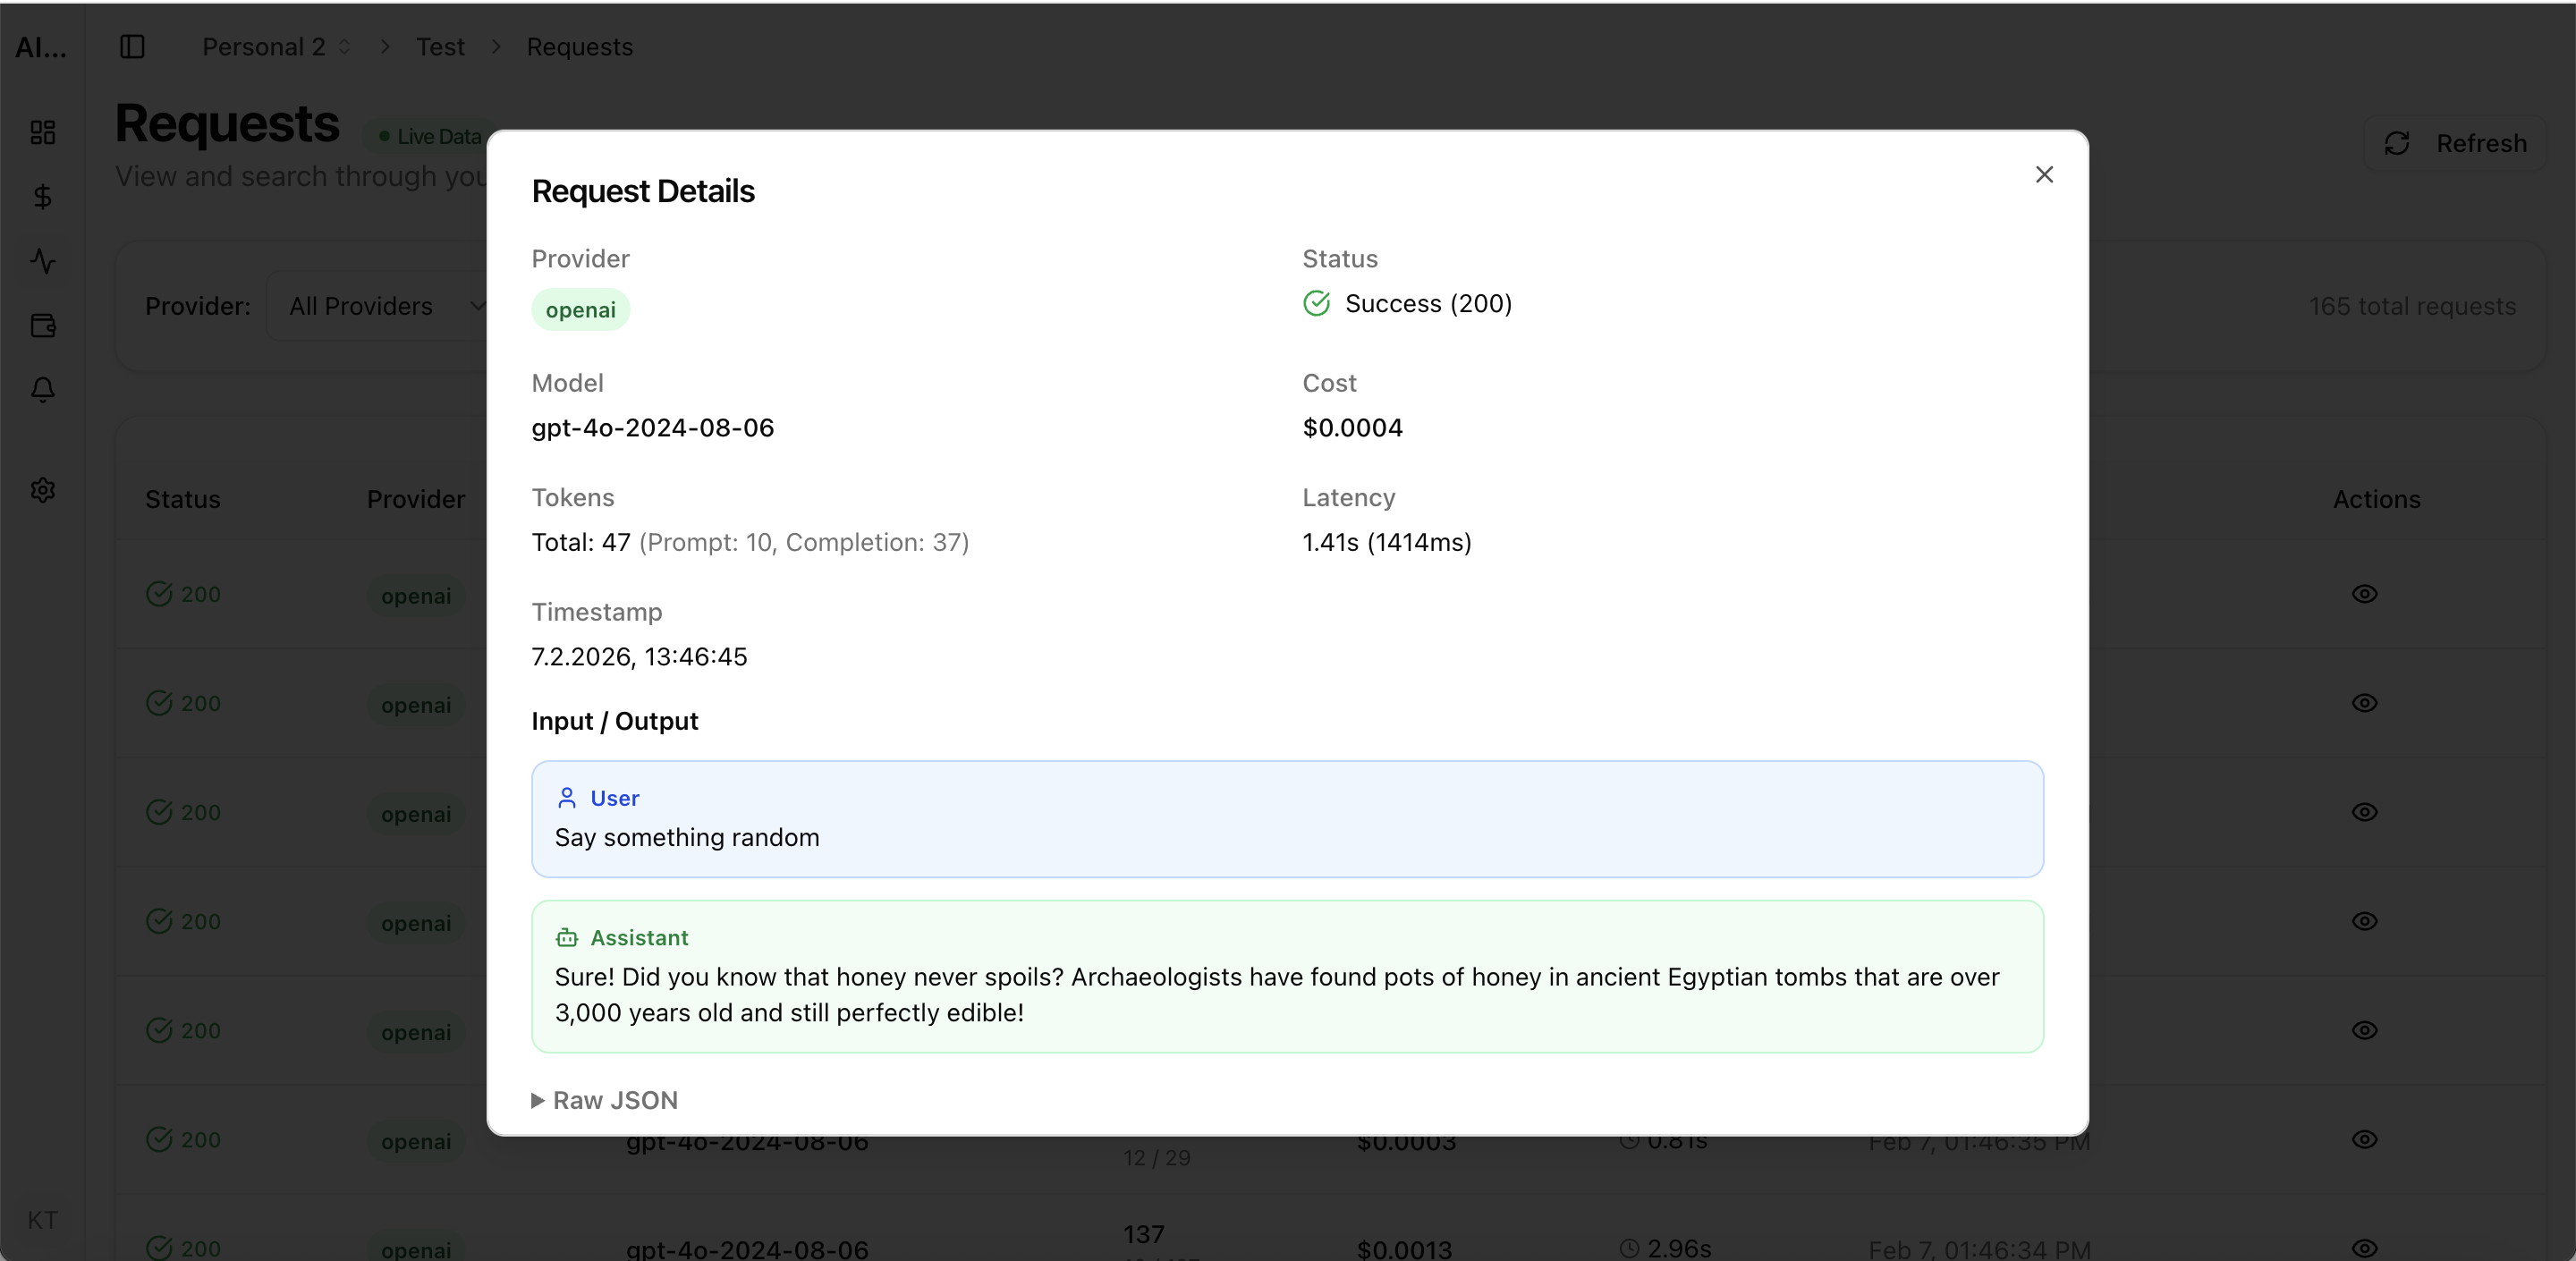
Real UI snapshot used to anchor the operational workflow described in this article.
Setting up LLM cost tracking should take minutes, not days. Many teams delay monitoring because they think it requires complex instrumentation, SDK integration, or infrastructure changes. With modern tools like AI Cost Board, you can go from zero visibility to a full cost dashboard in under 15 minutes using just your existing API keys. Here is the step-by-step process.
Real UI snapshot used to anchor the operational workflow described in this article.
Start by connecting your LLM provider API keys to AI Cost Board. Navigate to the provider integrations page and enter your keys for OpenAI, Anthropic, Google Gemini, or any supported provider. The platform immediately begins tracking all API calls made with these keys — no code changes, no SDK integration, no proxy setup required.
Create project workspaces that match your organization structure. Common approaches: one workspace per application, per team, or per environment (staging vs production). Assign API keys to the appropriate workspaces. This enables cost attribution — you will see exactly which project or team drives each dollar of AI spend.
Set up budget alerts before costs surprise you. Configure alerts at three thresholds: 50% of budget (informational), 80% of budget (warning), and 100% of budget (critical). Set alerts per project, per provider, or at the organization level. Choose notification channels — email, Slack, or webhooks. Budget alerts are the single most valuable feature for preventing overspending.
Within minutes of connecting API keys, your dashboard shows: total spend by provider, cost breakdown by model, usage trends over time, per-project attribution, and cost-per-request metrics. Use these views to establish baseline spending patterns. Review the dashboard daily for the first week to understand your normal cost patterns, then weekly for ongoing governance.
Invite team members to the dashboard with appropriate access levels. Engineering leads see detailed per-request metrics. Finance sees aggregated cost reports. Set up automated weekly cost reports delivered via email. Create shared views for stakeholder reviews. Cost transparency across the organization prevents the common pattern of engineering and finance discovering AI costs only at quarter-end.
Multi-Provider LLM Strategy: How to Reduce Risk and Improve Uptime in Production
provider-strategy · how-to
AI Cost Anomaly Detection Playbook for High-Volume LLM Products
observability · how-to
Expensive Prompt Red Team Checklist: Find Cost Risks Before Production
governance · how-to
How to Track LLM API Costs Across Multiple Providers
cost-tracking · how-to
LLM cost tracking setup should not be a project — it should be a 15-minute task. Connect your API keys, set budget alerts, and start monitoring today. The cost of not monitoring always exceeds the cost of setting up tracking.