Proof from the product
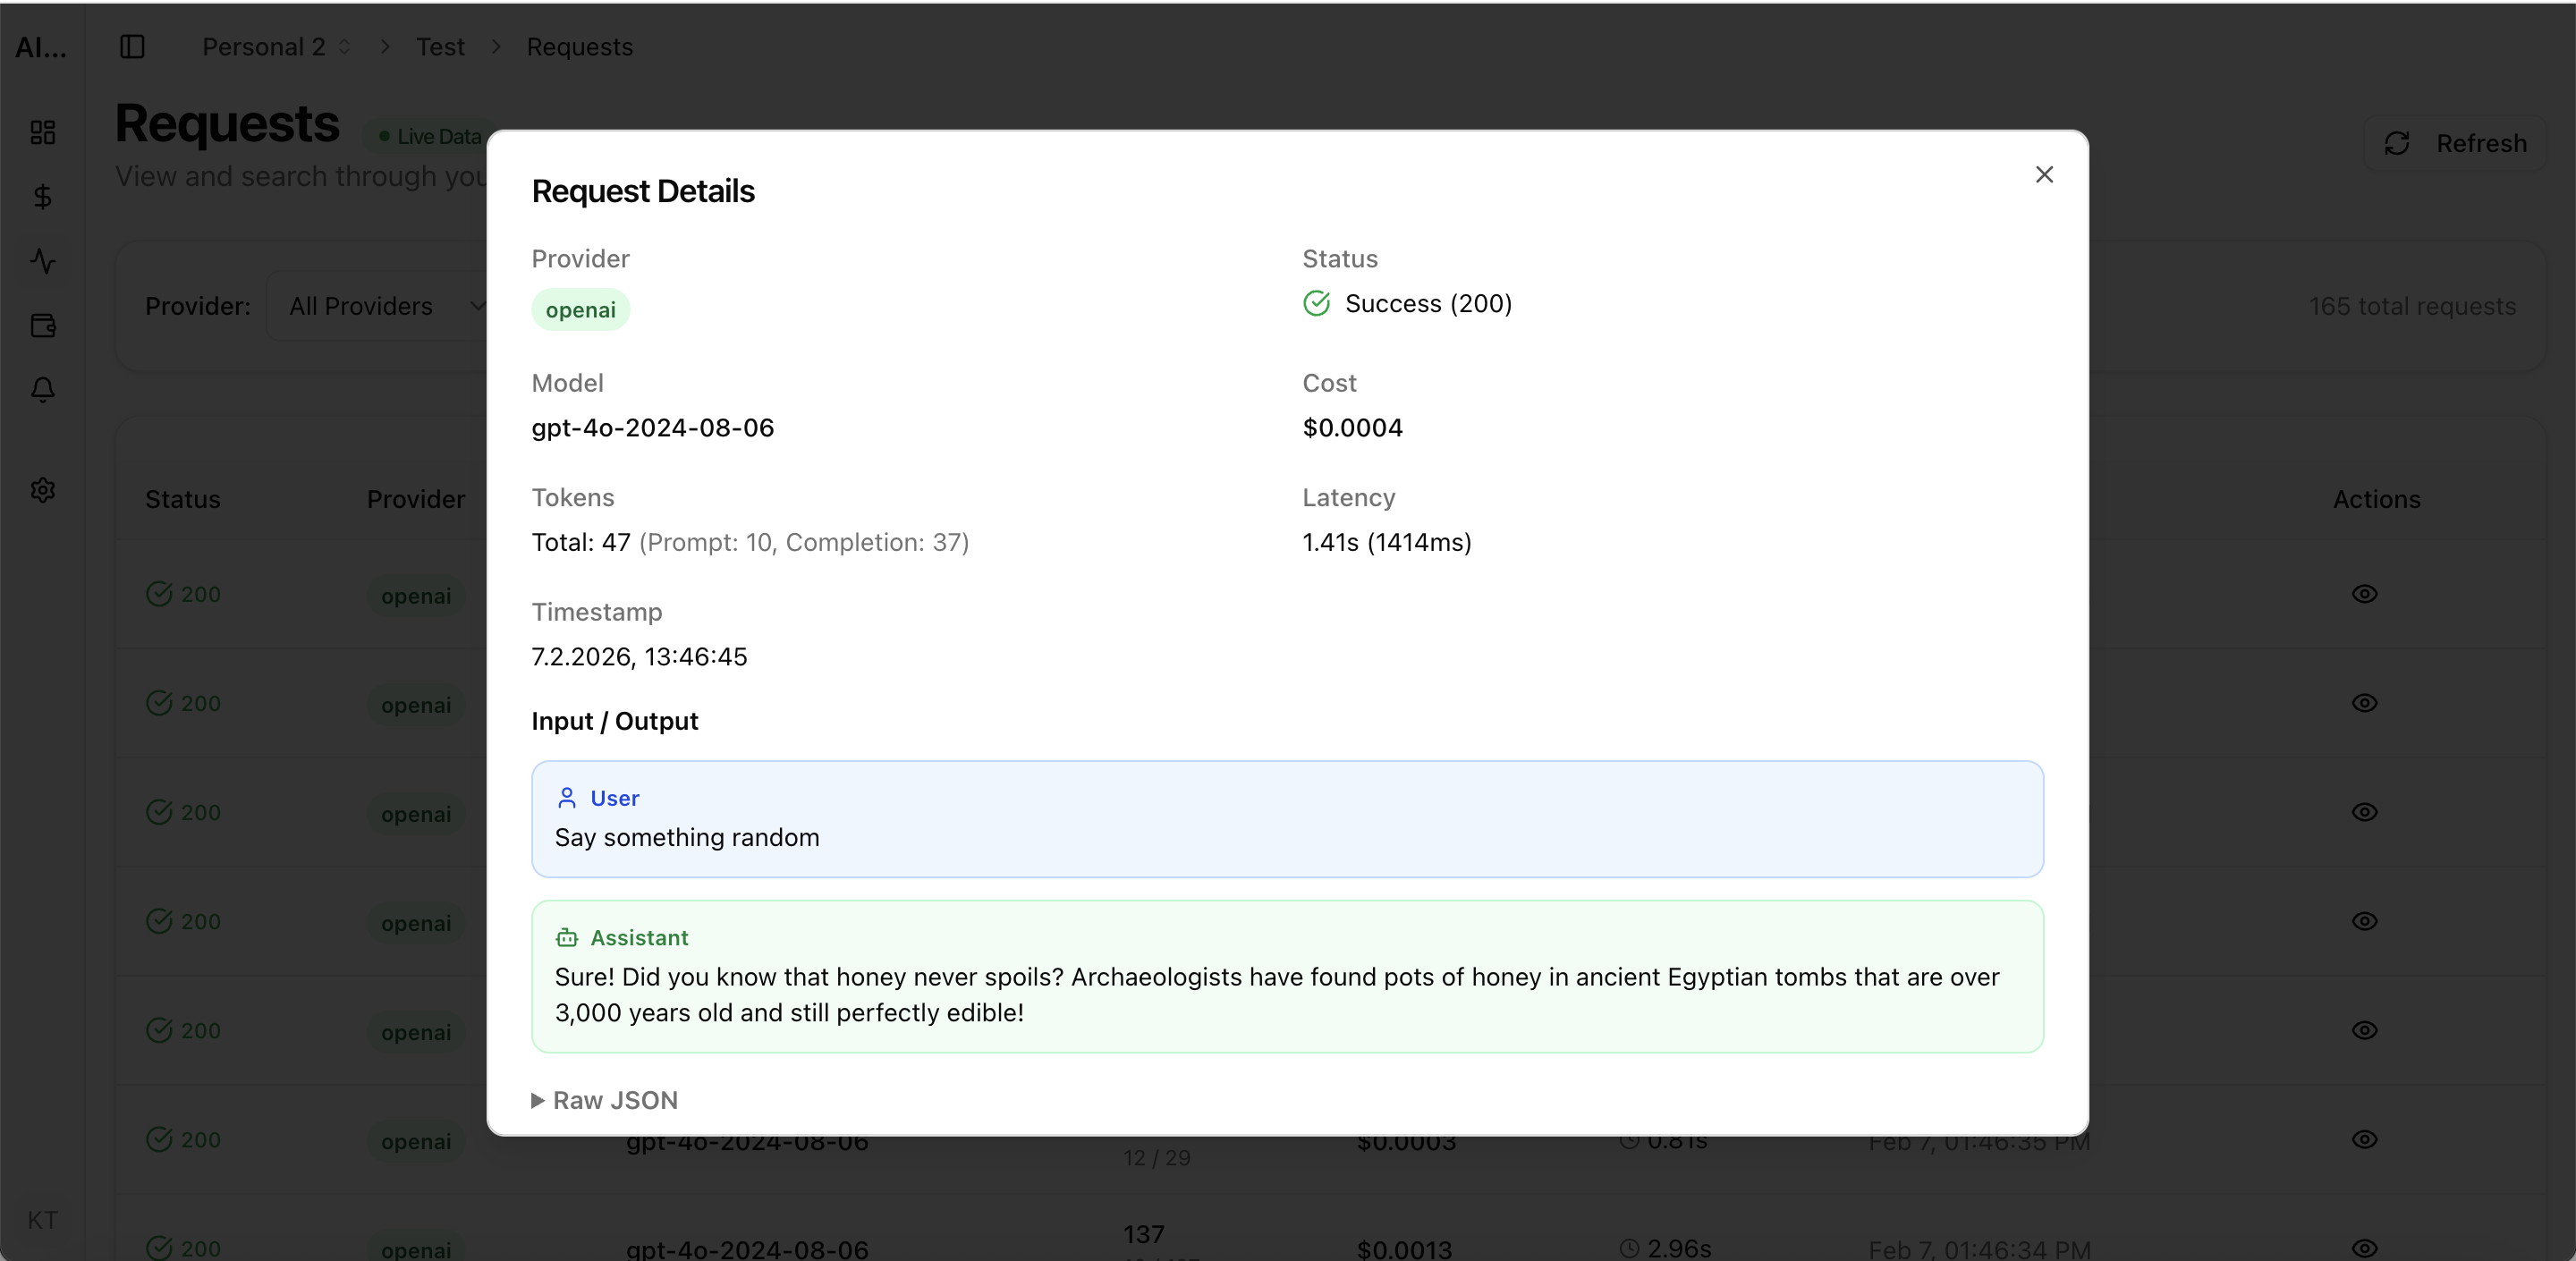
Real UI snapshot used to anchor the operational workflow described in this article.
LLM observability is the practice of monitoring, understanding, and optimizing large language model operations in production. Unlike traditional software observability, LLM workloads require tracking token usage, model-specific latency patterns, cost per request, and output quality — all in real time. This guide covers every aspect of building a production-grade LLM observability stack in 2026.
Real UI snapshot used to anchor the operational workflow described in this article.
LLM observability goes beyond uptime monitoring. It encompasses request-level logging with full input/output capture, token usage tracking, latency percentile analysis, error categorization by provider, cost attribution per request and project, and quality/hallucination detection. Without observability, teams fly blind on the most expensive and unpredictable part of their stack.
The five pillars are: (1) Request Logs — capture every API call with input, output, tokens, latency, and cost. (2) Cost Analytics — track spend by provider, model, project, and team. (3) Performance Monitoring — measure latency distributions, error rates, and throughput. (4) Budget Governance — enforce spending limits and detect anomalies. (5) Quality Tracking — monitor output consistency and flag regressions.
Evaluate platforms on six criteria: provider coverage (how many LLM APIs are supported), setup complexity (proxy vs API key integration), cost attribution depth (project and team level), alerting capabilities (budget, anomaly, performance), reporting (finance-ready exports), and pricing model (per-request vs flat rate). Tools like AI Cost Board, Helicone, and Langfuse each emphasize different aspects.
The foundation of LLM observability is comprehensive request logging. Every API call should be captured with: model used, input/output token counts, latency, HTTP status, cost (calculated from current pricing), and project attribution. AI Cost Board automatically captures this data through API key integration without requiring code-level instrumentation.
Configure three types of alerts: (1) Budget alerts that trigger when daily or monthly spend approaches thresholds. (2) Anomaly alerts that detect unusual patterns like sudden cost spikes or latency degradation. (3) Error alerts for elevated failure rates or new error types. Effective alerting turns observability from passive monitoring into active cost governance.
Start monitoring before you need it — retrofit is harder than setup. Use project-level attribution from day one. Set conservative budget alerts and tighten as you learn usage patterns. Review cost reports weekly with engineering and finance stakeholders. Choose tools that grow with your stack rather than locking you into a single vendor approach.
LLM Cost Optimization Guide: 11 Tactics to Reduce AI Spend Without Losing Quality
cost-optimization · framework
AI Observability Stack for SaaS Teams: What to Measure Beyond Tokens and Spend
observability · framework
AI Feature Unit Economics Framework for SaaS and Agency Teams
cost-optimization · framework
AI Cost Anomaly Detection Playbook for High-Volume LLM Products
observability · how-to
LLM observability is the difference between controlled AI operations and runaway costs. Invest in monitoring infrastructure early, choose tools that match your governance needs, and build a culture of cost-aware AI development.