Proof from the product
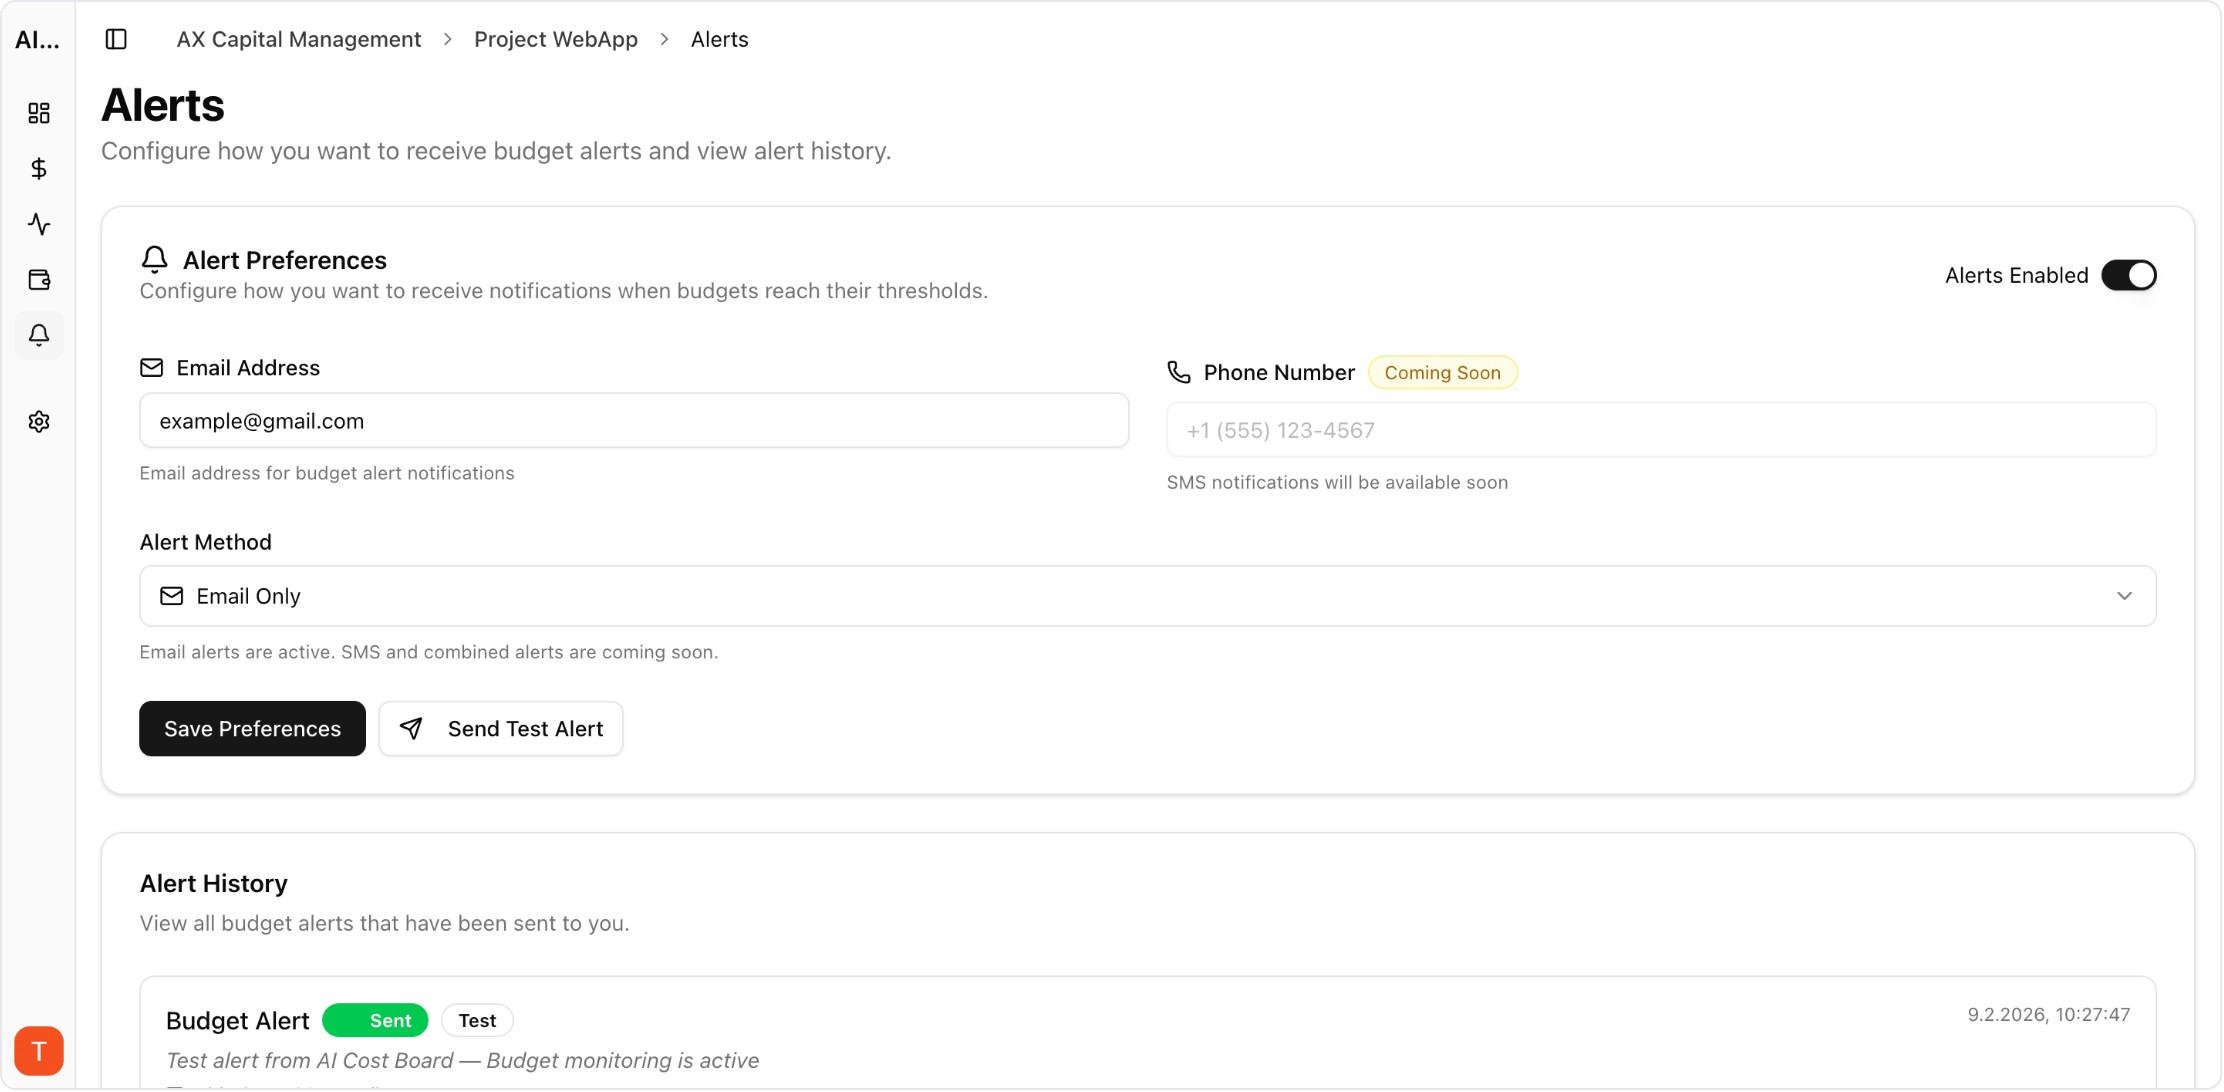
Real UI snapshot used to anchor the operational workflow described in this article.
Most teams start with one metric: monthly AI spend. But spend alone does not explain reliability, user experience, or quality drift. A real observability stack helps you debug faster and make better routing decisions.
Real UI snapshot used to anchor the operational workflow described in this article.
Track request volume, total tokens, cost per request, p95 latency, error rate, and success rate. These six metrics create a baseline that engineering and product can both use.
Aggregates hide critical details. Keep searchable logs with model, provider, token split, latency, and status code. Request-level drill-down is essential for incident response.
Latency variance is often provider-specific. Compare model-provider pairs over time to identify unstable combinations and automatically reroute traffic during degradation.
Group failures by endpoint, provider, and project. Build alert rules that trigger only on meaningful spikes to avoid alert fatigue while still catching production regressions early.
If ownership is unclear, incidents stall. Use workspaces and projects so each team has clear accountability for budget, performance, and provider config.
LLM Cost Optimization Guide: 11 Tactics to Reduce AI Spend Without Losing Quality
cost-optimization · framework
AI Feature Unit Economics Framework for SaaS and Agency Teams
cost-optimization · framework
AI Cost Anomaly Detection Playbook for High-Volume LLM Products
observability · how-to
Copilot Feature Profitability Analysis: Measure AI Assistants Like a Product Line
cost-optimization · framework
AI observability is the control plane for scaling AI features safely. Teams with strong visibility spend less time guessing and more time shipping improvements.